A list of assessed and announced by the US Government:
| Inflation | ||
| The Fed make their decision in setting of interest rate and monetary policies based on a number of factors. Inflation and unemployment are some of the important ones. Even a speculative move will result in change in the stock market, exchange rates, etc. The market pays a lot of attention to what the Fed announces, and the trends of their decisions. | ||
|
CPI Consumer Price Index |
CPI is Consumer Price Index, which provides an indication of inflation. There are other indicators such as Core CPI 核心通脹 which excludes food and energy, Super Core CPI which deducts housing further, PCE 個人消費支出物價指數, etc. CPI is normally higher than CPE but usually very close and in sync. Inflation is one of the important indicators based on which the Fed make decision on the interest rate and monetary policies. The market believes the
|
TradingView Charts |
| Inflation Rate |
Inflation rate is the percentage of change in the CPI over a specific period. The FED targets inflation rate @ around 2.0% in the year 2025. The market generally believe that the FED will adjust the interest rate to achieve this target over time. Note that this target might change over a period of time. |
TradingView Charts |
|
Core CPI |
Core CPI 核心通脹 comes from CPI but excludes food and energy. In general, the Federal Reserve places greater emphasis on Core CPI than headline CPI when making interest rate decisions, which excludes more volatile food and energy prices, and provides a clearer view of underlying price trends. |
TradingView Charts |
通脹怎樣影響貨幣政策,而又怎樣影響世界經濟
| [10:01] |
通脹 CPI 是由幾樣東西決定的:
|
| [12:26] |
其實通脹原因只是幾樣東西決定的:
|
| [16:25] |
如果不壓抑通脹繼續發展下去,而人們期待通脹不斷上升,一定會成為超級通脹,演變成 Stagflation
|
Employment or jobs data plays a critical role in shaping the U.S. economy and is closely watched by investors for several reasons. These data provide insights into the health of the labor market, consumer spending, inflationary pressures, and overall economic growth.
失業率是否長期均衡還是催升,表示是否正常,另外,職位空缺 (Jobs Openings, Vacancy Rates),兩個數字顯示出超出或者不足夠的程度。(ref)
Here's a detailed look from an investor's perspective:
| Indicator of Economic Health |
e.g. A significant rise in unemployment claims might signal a downturn, prompting investors to shift to safer assets like bonds or gold. |
| Influence on Consumer Spending |
e.g. If jobs data show wage growth, it may boost retail and consumer-oriented stocks, as people have more disposable income. |
| Impact on Federal Reserve Policy |
e.g. A strong Non-Farm Payrolls (NFP) report may increase expectations of rate hikes, negatively impacting growth stocks sensitive to higher borrowing costs. |
| Inflation Expectations |
e.g. High wage growth might drive investors to favor inflation-protected securities like TIPS or shift away from companies with narrow profit margins. |
| Sector-Specific Insights |
|
| Sentiment & Market Predictions |
e.g. A surprisingly strong or weak jobs report may trigger a rapid re-evaluation of market outlooks, affecting stocks, bonds, and forex markets. |
| Global Implications |
|
| Key Data Releases to Watch |
|
| From an Investor's Strategy Perspective |
|
| Others | Investors need to interpret jobs data in the context of other economic indicators, the Federal Reserve's stance, and global economic conditions to make informed decisions. Let me know if you'd like a deeper dive into any specific aspect! |
Data |
|
| Initial Jobless Claims 初請失業金人數 |
初領失業救濟金人數,量度上星期首次申請失業救濟金人數,是美國最早公佈的經濟數據。由於數字每星期公佈,因此其影響性亦隨之而變。如果指標比預期高,應視為美元強勢/上漲,反之,則應視為美元弱勢/走跌。 |
| US Non-Farm Payrolls | |
| Labor Force Statistics | |
| US Population |
TradingView Charts |
GDP 美國國內生產總值 Gross Domestic Product 是一個衡量國家經濟的重要指標,指某個國家或地區在特定時間內(如一年)生產的所有最終商品和服務的總貨幣價值。它反映了一個經濟體的規模和健康狀況,顯示有多少經濟活動(如製造業、服務業或農業)在該地區發生,是量度經濟體活動及整體健康的首要指標。如果指標比預期高,應視為美元強勢/上漲,反之,則應視為美元弱勢/走跌。
| GDP (QoQ) | |
| US Current Account |
A key measure in the balance of payments tracking the flow of goods, services, income and transfers between US and the rest of the world. This figure reflects International Trade Transactions and often affects decison of trade policy of the US Governmetn with other countries in view of global imbalances. |
Petroleum
Petroleum impacts a lot in the economy of most every country, across energy, transprot, industry, agriculture, and in particular it can affect inflation, consumer spending, GDP growth, business activities, trade balances, geopolitics and financial markets, etc.
| Crude Oil | 按過往經驗,在商品市場中,隨著金價升勢,跟著就是銀、銅、石油 | |
| Strategic Petroleum Reserve (SPR) | SPR is the US's emergency stockpile of crude oil, created to reduce the impact of severe supply disruptions, managed by the US Department of Energy (DOE). The US government has established plan to stock their SPR, which very often is one of the factor investors will look at. | DOE |
| SPR Stocks. The US Govt will refill their stock when oil price is below $79. | ||
The Federal Reserve System, commonly referred to as "FED", is the central banking system in US. They are responsible for the Interest Rates, Quantitative Easing / Tightening and Economic Signals.
| Interest Rate & FOMC Announcements | ||||||
| Announcements from FED normally leads to immediate actions in stock, bond and forex markets. Investors adjust their strategies based on expected or actual changes in FED policy, particularly around interest rates or inflation forecasts. | ||||||
|
Interest Rate |
The interest rate will also affect the interest rate for the US Government Bonds. Announcement normally made at 2:00 am HKT followed by FED Chairman speech around 2:30 am. |
|||||
| Dot Plot | Quarterly updated chart presented in the Summary of Economic Projections Reports that alows tracking of projection of interest rate from FED members |
|
||||
| FOMC Meetings | FOMC holds 8 regularly scheduled meetings in a year, or more as needed | |||||
| FOMC Statements | FOMC issues statements directly on FED's website, typically at 2:00 pm ET on last day of their meetings | |||||
|
FOMC Press Conference |
Core CPI 核心通脹 comes from CPI but excludes food and energy |
Immediate News on YouTube: |
||||
| Social Media | FED's official X account @federalreserve | |||||
| Federal Debt | ||||||
| Federal Public Debt | Federal debt exceeding 90-100% of GDP can signal risks. It impacts decisions across asset classes. Extra spending on interests on debts adds to the burden of Government spending, and affect decisions of interest rates by the FRED. | |||||
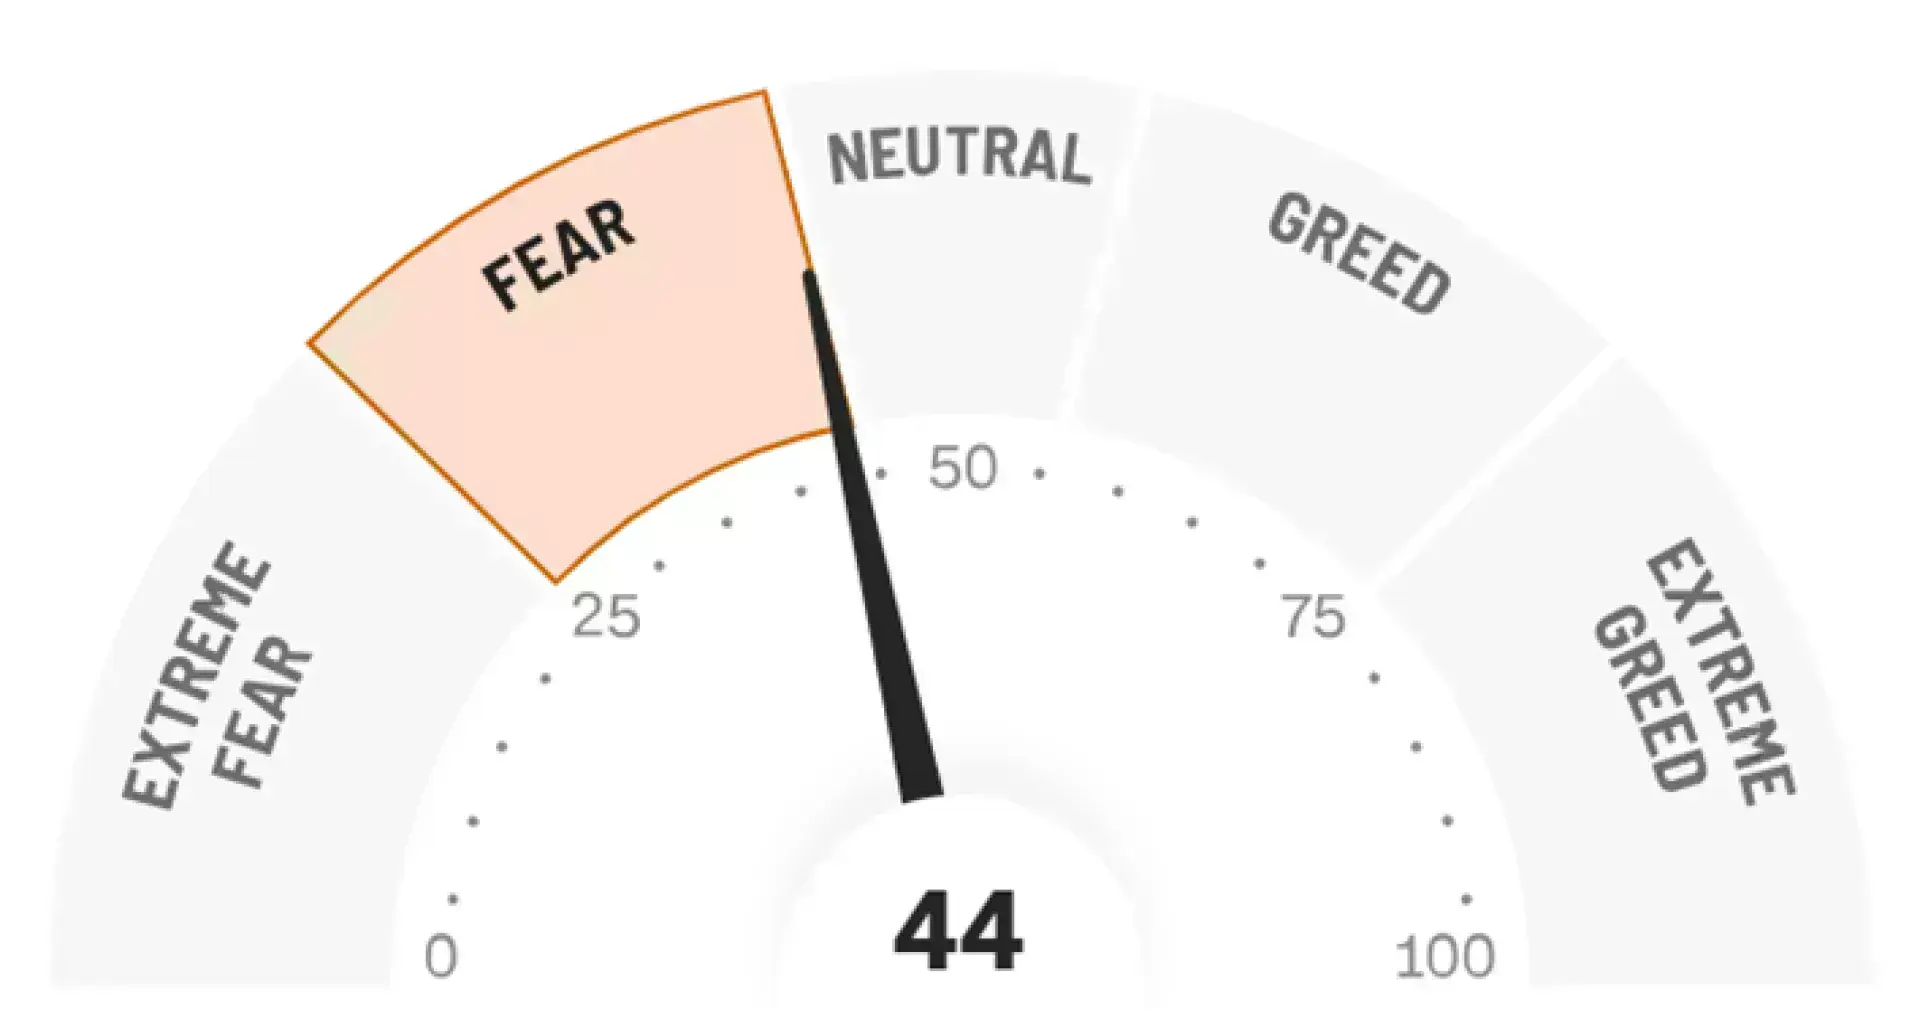
Fear & Greed Index
- The Fear & Greed Index is an index by CNN to gauge stock market movements and whether stocks are fairly priced, based on logic to calculate excessive fear tends or greed trends
- It can be interpreted as the mood of the market, the fear and greed sentiment indicator to alert investors to their own emotions and biases that can influence their decisions.
CNN 恐懼與貪婪指數(Fear and Greed Index)是一個由CNN Business開發的工具,用來量度投資者市場情緒的指標。這個指數範圍從0到100,其中:
- 0-25:表示「極度恐懼」(Extreme Fear),建議投資者可能應該考慮買入,因為恐懼可能導致市場被低估。
- 25-45:表示「恐懼」(Fear),市場可能處於賣壓較大的狀態,一些投資者可能會開始尋找買入機會。
- 45-55:表示「中性」(Neutral),市場情緒較為平衡,不特別傾向於恐懼或貪婪。
- 55-75:表示「貪婪」(Greed),投資者對市場顯得樂觀,可能意味著市場價格已經過高,適宜考慮獲利了結。
- 75-100:表示「極度貪婪」(Extreme Greed),這可能是一個警告信號,提示市場可能過熱,投資者應該謹慎,考慮減持或退出。
詮釋:
- 恐懼指數高時,投資者可能對市場前景感到悲觀,導致股票價格可能被低估,這時可能出現買入的機會。
- 貪婪指數高時,市場可能被過度樂觀推高,價格可能超出其內在價值,這可能是賣出或減持的信號。
應用:
- 作為逆向投資的指標:
- 在「極度恐懼」時,投資者可能發現買入被低估股票的機會,因為市場恐慌可能導致價格低於其價值。
- 在「極度貪婪」時,可能是一個賣出的時機,因為市場可能隨時修正。
- 風險管理:
- 指數可以幫助投資者評估市場風險。高貪婪指數可能提醒投資者注意風險管理,降低風險敞口。
- 市場時間選擇:
- 雖然不應該完全依賴這個指數來做市場時間選擇,但它可以作為其他分析工具(如基本面分析、技術分析)的補充,用來確認市場情緒的極端狀態。
- 心理反應的校準:
- 幫助投資者意識到市場情緒對自身決策的影響,從而避免因群體心理而做出的非理性決策。
注意事項:
- 恐懼與貪婪指數僅為工具之一,不應作為投資決策的唯一依據。它反映的是短期市場情緒,並不保證長期市場走勢。
- 應用時,結合其他分析方法,如基本面分析、技術分析,以及宏觀經濟數據來進行全面的投資決定。
總之,這個指數在理解市場情緒和潛在的價格走勢方面是有用的,但它需要與其他分析方法一同使用以形成更全面、更理性的投資策略。
Ref: from Grok2 2025-02-17
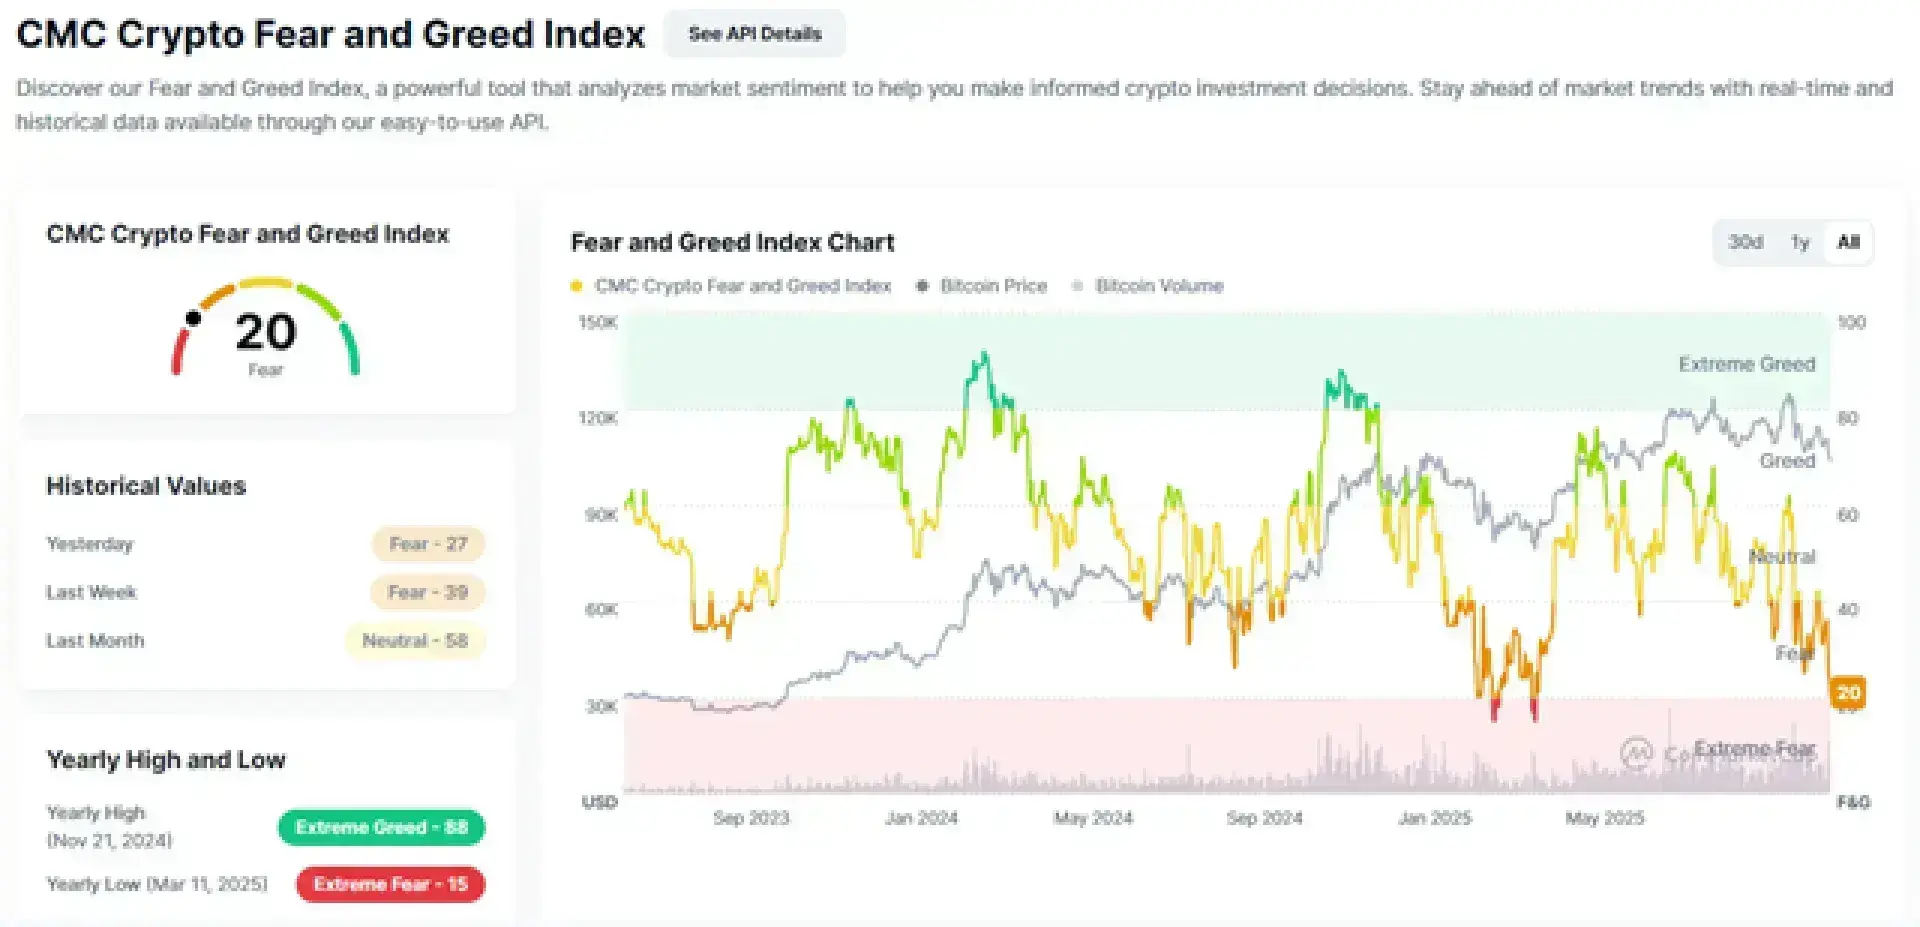
CMC Crypto Fear & Greed Index
- A proprietary tool developed by CoinMarketCap to measure the prevailing sentiment in the cryptocurrency market. This index ranges from 0 to 100, where lower value indicates extreme fear, and higher value indicates extreme greed.
- This index combines 5 components - price momentum of top coins, BTC/ETH implied volatility (BVIV/EVIV), options put/call ratios, market composition (e.g. stablecoin supply ratio vs BTC), and CMC proprietary social/engagement data.
CNN 恐懼與貪婪指數(Fear and Greed Index)是一個由CNN Business開發的工具,用來量度投資者市場情緒的指標。這個指數範圍從0到100,其中:
- 0-25:表示「極度恐懼」(Extreme Fear),建議投資者可能應該考慮買入,因為恐懼可能導致市場被低估。
- 25-45:表示「恐懼」(Fear),市場可能處於賣壓較大的狀態,一些投資者可能會開始尋找買入機會。
- 45-55:表示「中性」(Neutral),市場情緒較為平衡,不特別傾向於恐懼或貪婪。
- 55-75:表示「貪婪」(Greed),投資者對市場顯得樂觀,可能意味著市場價格已經過高,適宜考慮獲利了結。
- 75-100:表示「極度貪婪」(Extreme Greed),這可能是一個警告信號,提示市場可能過熱,投資者應該謹慎,考慮減持或退出。
詮釋:
- 恐懼指數高時,投資者可能對市場前景感到悲觀,導致股票價格可能被低估,這時可能出現買入的機會。
- 貪婪指數高時,市場可能被過度樂觀推高,價格可能超出其內在價值,這可能是賣出或減持的信號。
應用:
- 作為逆向投資的指標:
- 在「極度恐懼」時,投資者可能發現買入被低估股票的機會,因為市場恐慌可能導致價格低於其價值。
- 在「極度貪婪」時,可能是一個賣出的時機,因為市場可能隨時修正。
- 風險管理:
- 指數可以幫助投資者評估市場風險。高貪婪指數可能提醒投資者注意風險管理,降低風險敞口。
- 市場時間選擇:
- 雖然不應該完全依賴這個指數來做市場時間選擇,但它可以作為其他分析工具(如基本面分析、技術分析)的補充,用來確認市場情緒的極端狀態。
- 心理反應的校準:
- 幫助投資者意識到市場情緒對自身決策的影響,從而避免因群體心理而做出的非理性決策。
注意事項:
- 恐懼與貪婪指數僅為工具之一,不應作為投資決策的唯一依據。它反映的是短期市場情緒,並不保證長期市場走勢。
- 應用時,結合其他分析方法,如基本面分析、技術分析,以及宏觀經濟數據來進行全面的投資決定。
總之,這個指數在理解市場情緒和潛在的價格走勢方面是有用的,但它需要與其他分析方法一同使用以形成更全面、更理性的投資策略。
Ref: from Grok2 2025-02-17
Purchasing Manager's Index (PMI)
Purchasing Manager's Index
- derived from monthly surveys of private sector companies by the Institute of Supply Management (ISM) by sending surveys to PMs at companies across various industries about:
- new orders, production levels, supplier deliveries, inventories, employment
- indicates the prevailing direction of economic trends in the manufacturing and service sectors.
- It summarizes whether makret conditions, as viewed by purchasing managers, are expanding, staying the same, or contracting.
A PMI above 50 indicates the economy is expanding. A PMI below 50 indicates the economy is contracting. A PMI of 50 suggests no change.
PMI data is used by investors to get a sense of the overall health of the economy and to make informed decisions about where to invest their money. Example, a rising PMI might suggest that companies are increasing production, which could lead to higher profits and stock prices.
Types of PMI
- ISM Manufacturing PMI - released on 1st business day of each month at 10:00 am ET
- ISM Services PMI (Non-Manufacturing PMI) - released on 3rd business day of each month at 10:00 am ET
「Jackson Hole 經濟政策研討會」(又常被簡稱成 Jackson Hole Meeting)是由美國堪薩斯城聯邦準備銀行自 1978 年以來,每年在美國懷俄明州的 Jackson Hole 舉辦的重要會議。
它的重點與影響:
- 與會人士:主要是各國央行總裁、財政部長、金融主管機構官員、學者與投資人。
- 關注原因:美國聯準會(Fed)主席通常在會議中發表演講,市場會密切觀察其中透露的訊號,例如對未來利率、通膨控制或貨幣政策的方向。
- 歷史作用:過去幾任主席(例如 Ben Bernanke、Jerome Powell)都曾在這裡釋放過影響全球市場的重大政策暗示。
- 投資影響:因為美國貨幣政策牽動全球金融市場,所以此會議結果會影響股票、債券與外匯的價格走勢。
因此,如果你在投資或銀行相關的演講中聽到「Jackson Ho 會議」,極有可能指的就是 Jackson Hole 經濟政策研討會。
Jackson Hole 會議在投資市場中的重要性
Jackson Hole 經濟政策研討會是全球投資界最密切關注的事件之一,因為它經常為全球金融市場定下基調。其重要性主要體現在以下幾點:
| 貨幣政策訊號 | 美國聯準會(Fed)主席(目前是 Jerome Powell)會利用這個平台,來暗示未來在利率、通膨策略和資產負債表政策方面的動向。即使是措辭上的一個微小變化,都可能導致市場的劇烈波動。 |
| 市場波動性 | 全球投資者都會密切關注這些演講。如果聯準會暗示將收緊政策(例如升息),股市通常會下跌,而美元則會走強。如果暗示將放鬆政策(例如降息或推出刺激措施),股市可能會上漲,債券市場也會隨之調整。 |
| 全球影響力 | 這不僅僅關乎美國——其他國家的央行行長(如歐洲央行、日本央行等)也會出席,他們的評論可以影響全球經濟協調或分歧的預期。 |
| 歷史上的驚喜 | Jackson Hole 會議曾多次預示或暗示重大的政策,例如 量化寬鬆(2000年代) 和 通膨策略的轉變(2020年)。正因為如此,交易員、分析師和對沖基金幾乎將其視為一個「經濟神諭事件」。 |
| 投資者策略調整 | 投資組合經理人經常會根據聯準會的政策方向,在會議後調整其資產配置(例如股票、債券和貨幣之間的比例)。 |
Jackson Hole 會議是聯準會「暗示未來」的地方,而市場會隨之而動。 對於投資者來說,它就像一個即時的晴雨表,顯示著利率和流動性——這兩者是資產價格最大的驅動因素——的走向。
| Economic Calendar 財經日曆 |
通常包括全球重要經濟數據發布、央行會議、財報公布等時間表。如果你需要今天或本週的主要經濟事件,我可以幫你查找最新的日曆內容。市場一般對這些事件做出即時反應。 Note: For simplicity, select "This Week" and apply filters: US only, Display time only, Most important events |
| Polymarket |
一個真金白銀的預測市場平台,讓你可以針對現實世界事件的結果進行交易 - 涵蓋政治、體育、加密貨幣、科技、流行文化等。可以使用它來:
|
| Short Selling Turnover 沽空 | ||
| 市場的沽空行為,是一個相對短暫的市場氣氛,或者是大戶操作的手段,散戶投資者一般不懂得沽空。沽空的數字代表了聲勢的阻力。 | ||
|
Short Selling Turnover |
The HKEX discloses Short Selling Turnover every day, both and separately the morning and afternoon sessions | |
| Eligible Stocks for Short Selling |
Designated Securities Eligible for Short Selling
|
|
coming .....
Data |
|
| European Commission |
Executive Body of the EU (European Union) responsible for proposing legislation, implementing decisions, upholding EU treaties and manage the day-to-day business of the EU. It consists of 27 Commissioners, one from each EU member state. These Commissioners are nominated by their national governments but are expected to act independently in the interest of the EU as a whole, not on behalf of their home country. |
| EU Key Indicators |
The home of high-quality statistics and data on Europe, including Inflation Rate, GDP Growth, Unemployment Rate, House Price Growth, Population, Energy Inflation, Food Inflation. |
天然氣對世界經濟的影響,了解天然氣世界實際供需情況和相互關係
文字資料待上
| Market Sentiment | ||
| Some indicators are available to assess reactions from the market to determine how host people have done in action | ||
| 市寬 |
S&P 500 Stocks Above 50-Day Average 用來衡量市場的短期健康狀況和廣度,通常被視為市場情緒或潛在趨勢的指標。當較多的股票在其 50 日移動平均線上方時,市場通常被看作是強勢的,反之則可能表示市場疲弱或進入調整期。 |
|
| VIX 恐慌指數 |
Volatility S&P 500 Index 用來衡量市場情緒。當市場預期波動大時,VIX數值會上升;反之,波動小則VIX數值下降。
與標普500的反向關係: 當標普500上升時,VIX通常下降;當標普500下降時,VIX通常上升。 其他相關指數:
|
|
| MMFI 五十天均線上股票比例 |
在S&P500內,現價高於各自「50 日簡單移動平均線(50-DMA)」的股票所占比例(百分比)。 用來判斷上漲/下跌是否「廣泛參與」。如果大盤創高但 MMFI 走弱,表示領漲面縮小,風險升高。高 MMFI 通常確認上漲趨勢強勁;低 MMFI 確認下跌壓力廣泛。
|
|
| Market Sentiment | ||
| Some indicators are available to assess reactions from the market to determine how host people have done in action | ||
| MACD |
Moving Average Convergence / Divergence 移動平均匯聚背離 是一種追蹤股票、貨幣對、商品等價格動向的技術分析工具。MACD線 是12周期的指數移動平均線(EMA)減去26周期的EMA。信號線 是MACD線的9周期EMA。MACD柱 是MACD線減去信號線的結果。 其主要功能包括:
|
|
| RSI |
Relative Strength Index 相對強弱指數 用來衡量某特定時間段內,價格上漲與下跌的速度和變化。RSI的計算基於價格的平均漲幅與跌幅的比率,從而反映出市場是否過度買入或過度賣出。RSI的計算方法,通過比較一定時間段內的平均增益與平均損失來計算。通常,RSI的計算使用14個周期(天、週等),但也可以根據需求調整周期長度。RSI 的數值範圍在0到100之間。RSI 數值範圍高於70的時候,,市場可能被過度買入,價格可能會回落。RSI數值範圍低於30的時候,,市場可能被過度賣出,價格可能會反彈。
|
|
怎樣衡量一個圈家或地區的經濟
Origin: 利世民
| GDP | 一般市場用GDP 來衡量一個國家的經濟增長
|
| 人均收入 | 個人或家庭的平均收入,直接代表7經濟的指標,因為直接影響到消費的意欲 |
| 生產力 | 接入多少的資本、人力、成本,然後創造出來的利潤有多高,而生產力的增長,其寰也是經濟增長 |
| 人均收入 | |
| 國債 |
國債患率高低、變化、發行量
|
| 政府負債水平 |
一般負債較低代表經濟越好
|
| 經濟問題 |
首先看問題是遁期性的還是結惰性的
|
| 科技成長 |
從歷史上看,生產力的增長,直接與科技相關。科技帶動經濟的增長是長遠的,重要的, 所以看一個國家的經濟前景,還得看科技發展,而科技發展要看人和資源
|
| 資本 |
資本市場的變化
|
| 天然資源 |
資源是否真備,是否適合的資源,瓷源開發的成本,延續性等
|
| 人力資源 |
經濟的發展還得看頭鍵的人才
|
| 收入增長 |
生產力i~導致收入增長低、物價增長就會慢,假如收入這不上物價的增長,經濟就不會好,一般會看到少數人能夠拿到多數的利益,大部分人需要更畏的時間才會見到生活水平的上升,過程中唯有依賴政府的福利和救助,變成政府財政上的負擔。 長達來說,是需要社會基層的人能夠融入到新的經濟環境當中,即是要轉型,最終要依賴的,就是教育,但現代來說,就是教育的改革。 |


