This is a collection of tools created by the author for the purpose of personal investments.
This is a read-only file.
Make copies for your own use.
Disclaimer
This is a free service. The author holds no responsibility for any losses or consequences using this template. Please consider risks of your own when using the spreadsheet.
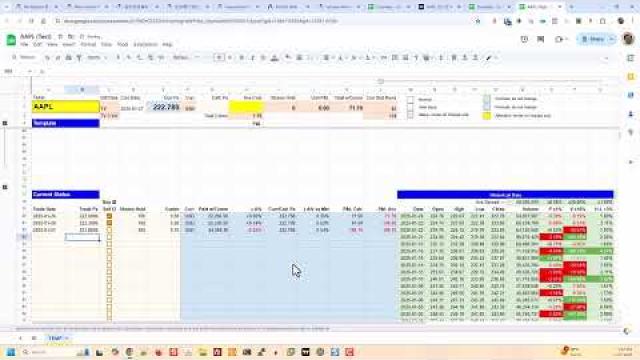
A Google Sheet Template for stock investment
In the process of day trades, transactions are fast and more frequent. The spreadsheet is designed to facilitate a fast and smooth workflow operation. Therefore after the initial setup, most of the operations are mainly enter minimal data and copy/paste. Automation are designed to facilitate decision on the spot, and historical data for comparisons.
This google sheet is designed to use on:
- HK & US Stocks
It can also be used on others but probably with some flaws. It can still be used but might require further changes or enhancements. The flaws include
- Automatic retrieval of current pricing in market - include Japan, Singapore stocks as well as forex investment. The spreadsheet is stilled used for such stocks with the understanding fo such flaws. When new solutions are found for those auto-retrieval data, the spreadsheet will be updated.
- Comparison of market index with historical data is limited to stocks in USD or HKD, which means only for US and HK stocks. In the case of US stocks, S&P500 index is used. For HK, the HSI is used. By default, the spreadsheet automatically select which index to display based on the currency entered whether it be USD or HKD. In some cases, such as forex using USD, comparison with S&P500 becomes meaningless as the co-relation is not high even though there could be.
This is a read-only file.
Make copies for your own use.
Disclaimer
This is a free service. The author holds no responsibility for any losses or consequences using this template. Please consider risks of your own when using the spreadsheet.
Configuration for Individual Stock
This video is a follow-up of the above previous video, about the initial setup configuration on the Google Sheet for individual stock. Additional explanations of the spreadsheet operation are included.
This video touches a little bit of the following in order to give a full picture but not in details.
- Additional data for HK stocks because by nature transactions are in HKD. Additional conversion to USD should be made when recording the result into the summary sheet. An extra column of such conversion is included to facilitate the workflow in a fast and convenient manner.
- There is a summary sheet which automatically group individual transaction results by date, by week and by month. These involves semi-automation process of the summary sheet, and is not described in details in this video.
You can design your own summary sheet, which is a separate file. As explained in the video, transaction data are transferred from the stock file to the summary file manually using copy / paste-by-value. It is totally possible to design your own summary sheet according to your own workflow and needs.
In the summary sheet of the author, there are additional data automatically retrieved from individual stock sheets for external data and investment on hand, for the need of the author. If you are interested, you're welcomed to contact the author separately. The semi-automation approach requires some more in-depth explanations and knowledge of spreadsheet & formula handling.
Before decision is made for buying / selling, the following focused questions will be very helpful:
| If the direction will go opposite for a period of time, will you still make the same decision to buy / sell | further consideration of unseen situations getting worse and your affordability, and make a final logical and rational judgment before your last minute decision and action |